














What is great about Cisco Webex Teams is that I can start working on the desktop client and pick up where I left off when I go mobile via my iOS or Android client. Since both the desktop and mobile clients support notifications, I never have to worry about receiving an important message from a team that I'm collaborating with. In addition to these benefits, there are a number of API's that allow you to create bots to enhance your workflows.
Recently I've had the opportunity to get to work with the powerful tools that AppDynamics (AppD) has to offer. In addition to automatically and dynamically mapping out your application flow and providing business transaction scoring and correlation, AppDynamics has a powerful monitoring and alert system. Like other monitoring systems you are able to send out SMS or email alerts based upon various criteria. What is really cool is that the AppDynamics controller can fire HTTP requests at a web server!
This opens up a variety of use cases where we can take advantage of the Webex Teams API's to do really cool things! For example, we coulddevelop a Cisco Webex Teams Bot that creates a triage space to start troubleshooting an issue that AppDynamics detects. The bot can also pre-populate the necessary team space members as well as post links/logs and other information necessary to hit the ground running in triaging the issue.
Let's get started!
I already have AppD monitoring a couple of my own Webex Teams Bots, so let's setup App Dynamics and a Webex Teams Bot to do the following in case a server I'm monitoring restarts. Here is a high level view of the architecture.
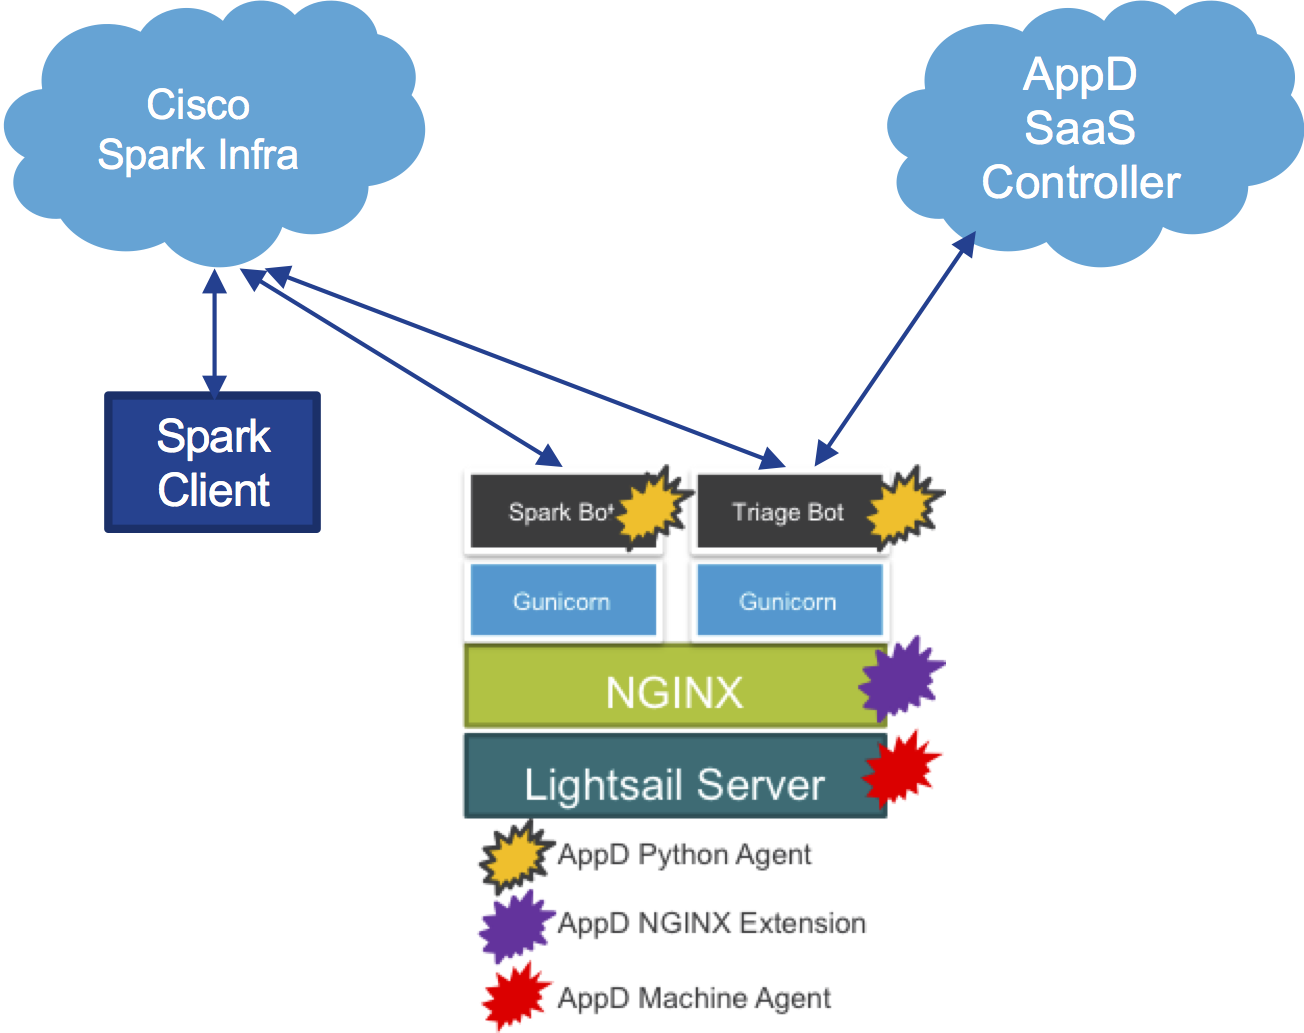 AppDynamics Webex Teams Triage Bot Architecture
 When AppD discovers a restart, I would like the following to happen:
Here is a high-level view of the call flow.
 AppDynamics/Triage WebEx Teams Bot High Level Call Flow
In order for the monitor and alert functionality to work on AppDynamics, you need to create a Policy that defines the criteria that you want to monitor and the action that you want to take. In order to do this, log into your controller and click the "Alert & Respond" Tab. Once you are on the "Alert & Respond" Tab, you will want to choose your application from the drop down menu and then click "Policies". This will take you to a list where you can edit, delete and create new policies.
 Path to creating your Alert and Respond Policy for your application workflow.
If you have not already done so, create/add a policy.
The monitoring criteria can be performance metrics, health rules related to business transaction performance or specific events like a server restart. It can really be anything you like. For example, say some of your business transactions start slowing down to unacceptable level. Trigger the alert! For the sake of simplicity, I've decided to go with a simple server restart.
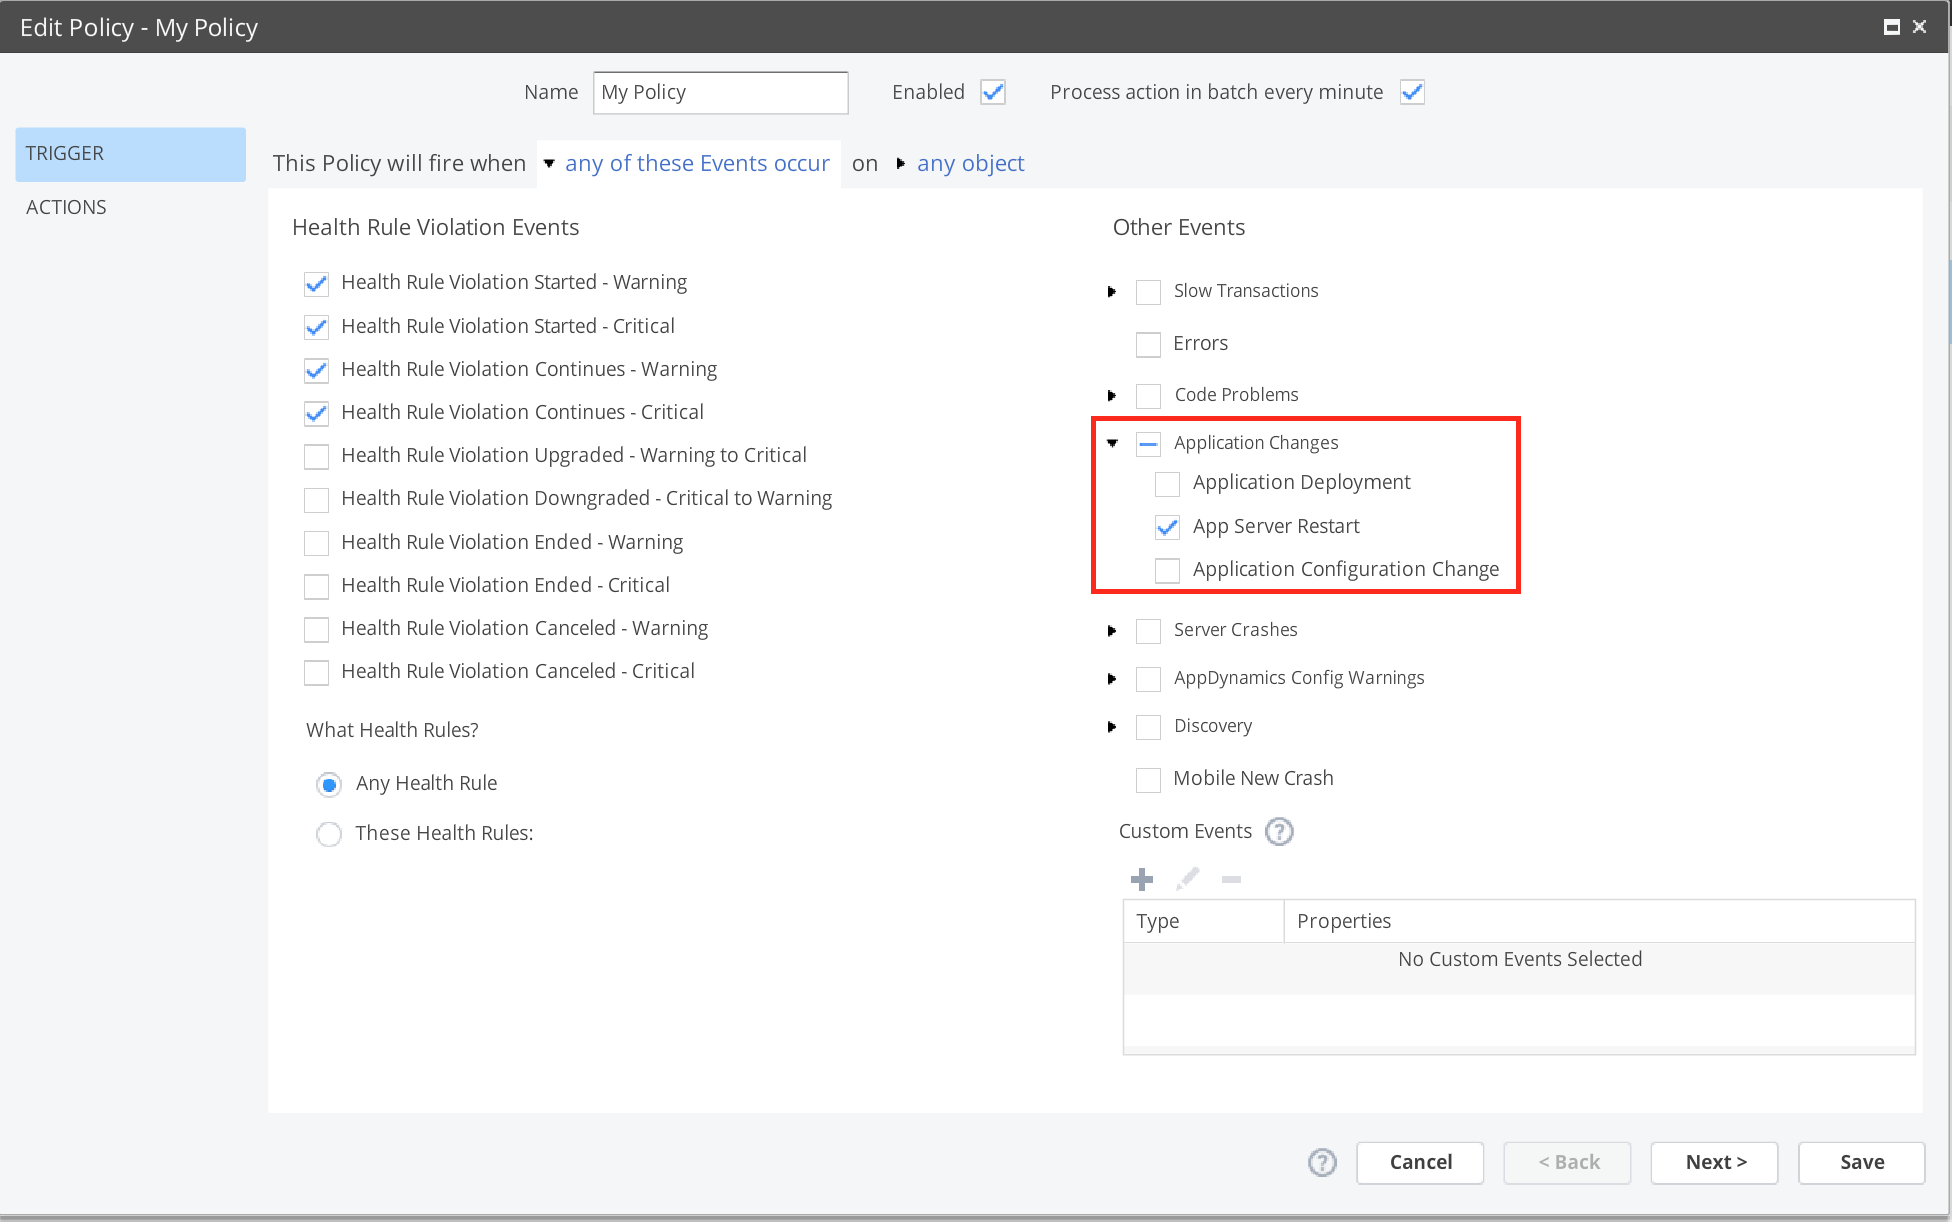
In order to take action with an HTTP Request, we first have to define an HTTP Request Template. With the policy and HTTP Request defined for our case, when a server that we are monitoring restarts, the AppD controller will fire an HTTP Request to our AppD Triage Bot.
Creating an HTTP Request Template is fairly straight forward and I'd recommend checking out the documentation for a quick primer. The main things you will need to fill out in the form includes:
It is this HTTP Request Payload that we need to customize that will allow us to really differentiate our bot and provide a lot of context to our Webex Teams triage space. The body will be a JSON dictionary that will contain two arrays, defined in the following way:
The team members are pretty easily populated, but how do we get events? Well, fortunately, the gurus at AppD allow scripting of the HTTP Template Request Body via Apache Velocity. In a nutshell, the Apache Velocity Templating language allows us to populate the contents of the request body at alert time so that we have the most up to date contextual information possible.
here is the JSON body snippet for the payload template:
[cc lang="python" width="600
 Etiquetas calientes:
destacado
Cisco AppDynamics
Python
Webex Teams
CiscoSE
Sparkbots
#ciscospark