









In my previous blog, we looked at how Catalyst switches can be used to assess video application readiness in the network before rolling out a video based collaboration application. In this blog, let us take a look at available tools on the Catalyst switches to monitor and troubleshoot video problems in the network.
As we know, fundamentally, video traffic is different from data traffic. Video traffic is more dynamic and bandwidth intensive and even small changes in delay or loss can cause visible disruptions to user experience. Routinely, IT trouble tickets are opened by users that are faced with degraded video experience. To add to that, interactive video is real time. Any delay in troubleshooting will make IT miss the window to rectify the problem. For a firm with many locations and buildings, finding the problem can be complex and time consuming without the right tools.
Cisco Performance Monitoring and Mediatrace are two IOS software features that are available on Catalyst switches for video traffic monitoring and troubleshooting.
Performance Monitoringallows IT administrators to set metrics on the Catalyst switches that correspond to acceptable quality for video as it travels through these switches. When the actual video quality goes below the acceptable metrics, the switch raises automatic alerts to IT. The metrics can be acceptable round trip time, latency, jitter etc.
Mediatraceallows IT administrators to trace video hop by hop across the network to detect problems along its path.
IT can run these tools on demand or schedule them periodically to look for trends. Cisco Prime, Cisco's network management application, can provide powerful visualization capabilities for the results of Mediatrace. For example, it can pictorially show the hop by hop measurements of the video traffic across the network.
Here are two use cases that show the functionalities in action.
Use Case 1: Performance Monitoring
Before Performance Monitoring: A firm has video IP phones and Telepresence collaboration service between 3 locations -San Francisco, London and Beijing. During times of traffic congestion or failures, users notice the poor video quality and raise IT trouble tickets. IT then investigates and repairs the affected area(s) of the network. In this case, IT did not have means to detect the problem before the trouble tickets were raised.
With Performance Monitoring: IT uses the Performance Monitoring tool to set metrics on the switches in the paths of the video between the 3 locations. If there is a congestion or failure, the switch in that path will notice the poor video quality by comparing the video metrics to the standard IT has set and automatically alert IT administrators through page/text. This happens even before the users realize the video quality has been affected, minimizing the number of IT trouble tickets.
Use Case 2: Mediatrace
Before Mediatrace: A firm has video IP phones and Telepresence collaboration service between 3 locations -San Francisco, London and Beijing. During a Telepresence session, a fault in the core switch results in pixelated video for the users. IT trouble ticket is raised. IT manually looks at the network configuration and logs into each switch/router in the path to discover the problem switch in the core. This is time consuming and users experience poor quality video for this entire duration of troubleshooting.
With Mediatrace: When the IT trouble ticket is raised, IT uses Mediatrace tool from the switch closest to the Telepresence device. The tool traces the entire path of the video through the network and IT discovers the problem switch in the core. The entire process is automatic reducing the time to troubleshoot.
So, what are the benefits to IT?
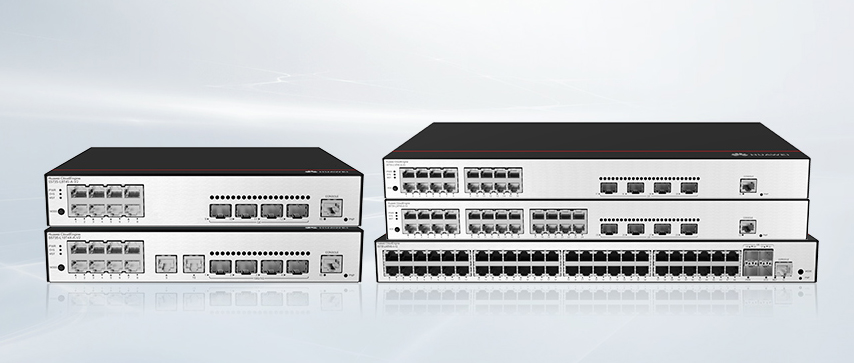
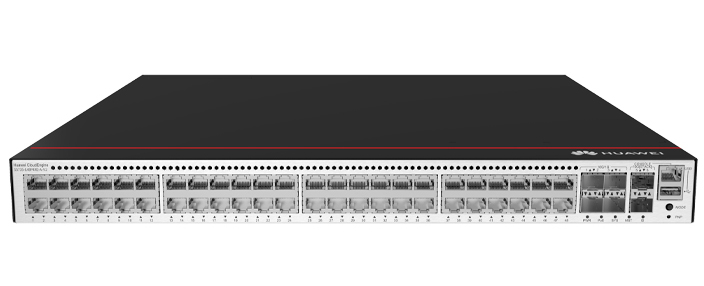
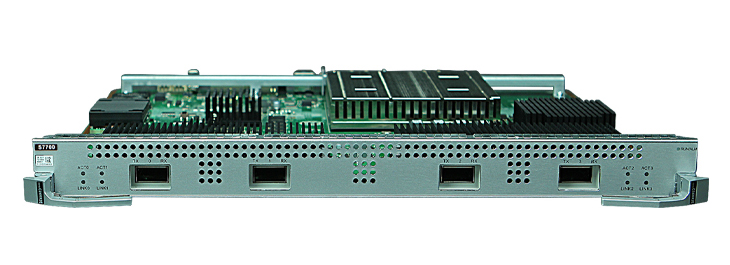
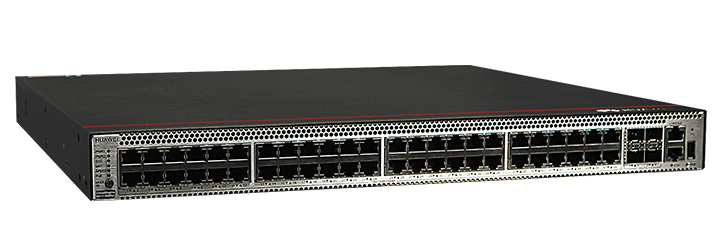
These two functionalities are available in the following Catalyst platforms.
For more information visit www.cisco.com/go/medianet
 Etiquetas calientes:
CISCO Switches
iOS
catalyst
cisco prime
mediatrace
Catalyst 3560-X
Catalyst 4500E
Catalyst 6500
Catalyst 3750-X